Sketching Graphs
In this topic we shall be exploring how to draw graphs. But before we do that let’s look at the different types of graphs that you can sketch. You must know these graphs by heart.
Linear Graphs
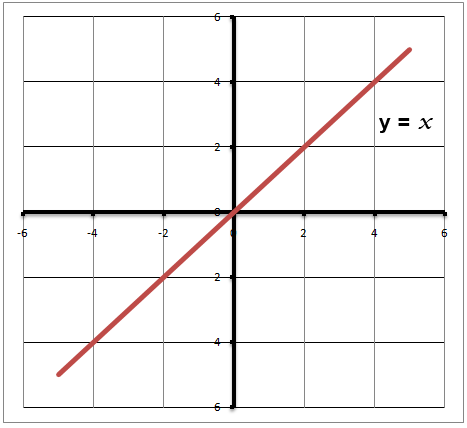
The graph shown above in the illustration is called a linear graph. Graphs of this form are drawn using an equation of the form y = mx+c Linear graphs are ever straight line graphs.
Quadratic Graphs
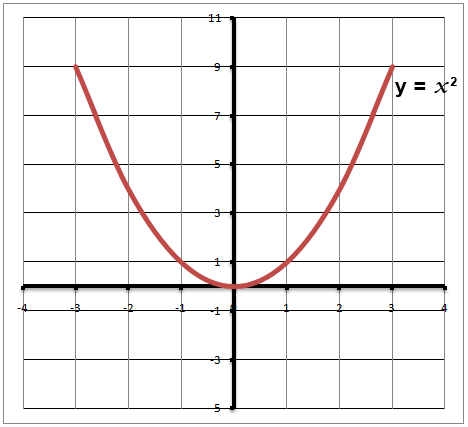
A quadratic graph such as the one shown in above is made using an equation of the form y = ax²+bx+c It has a distinctive cup shape.
Cubic Graphs
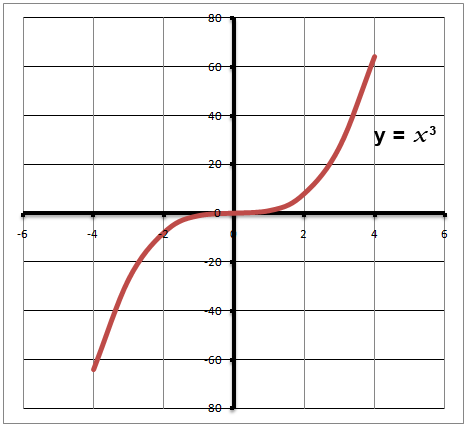
The cubic graph has been shown in the illustration above. Cubic graphs are formed using the equation of the form y=ax3+bx²+d. Note the first term in the equation has a cubic power.
Reciprocal Graphs
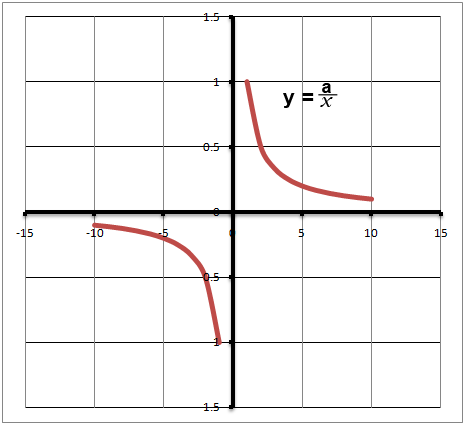
The graph shown has a reciprocal curve. Graphs of this form are made using the equation of the form y = a/x. The graph appears to have two curves.
Facts
Here we have the curve y=x²;
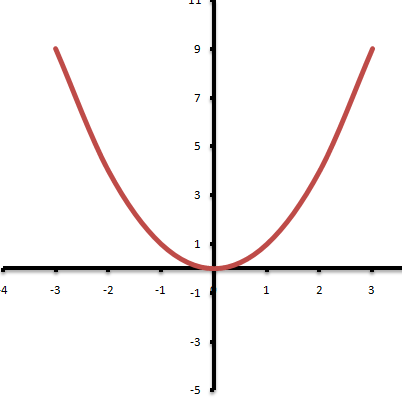
Note that the above is the default graph of the quadratic equation, there has been nothing added to the equation or multiplied. And now here is the curve of y = x² – 10 (blue) together with the curve of y = x²-10 (red)
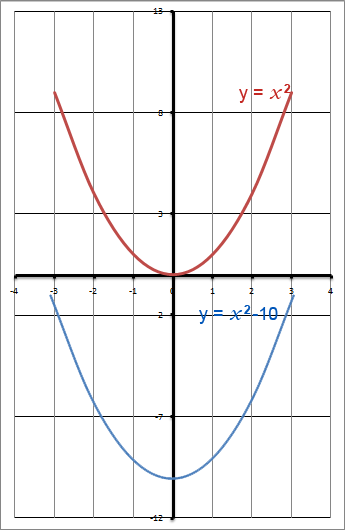
The curves are the same except the blue curve has been moved down (transformed) by taking 10 off the y values. He we conclude that;
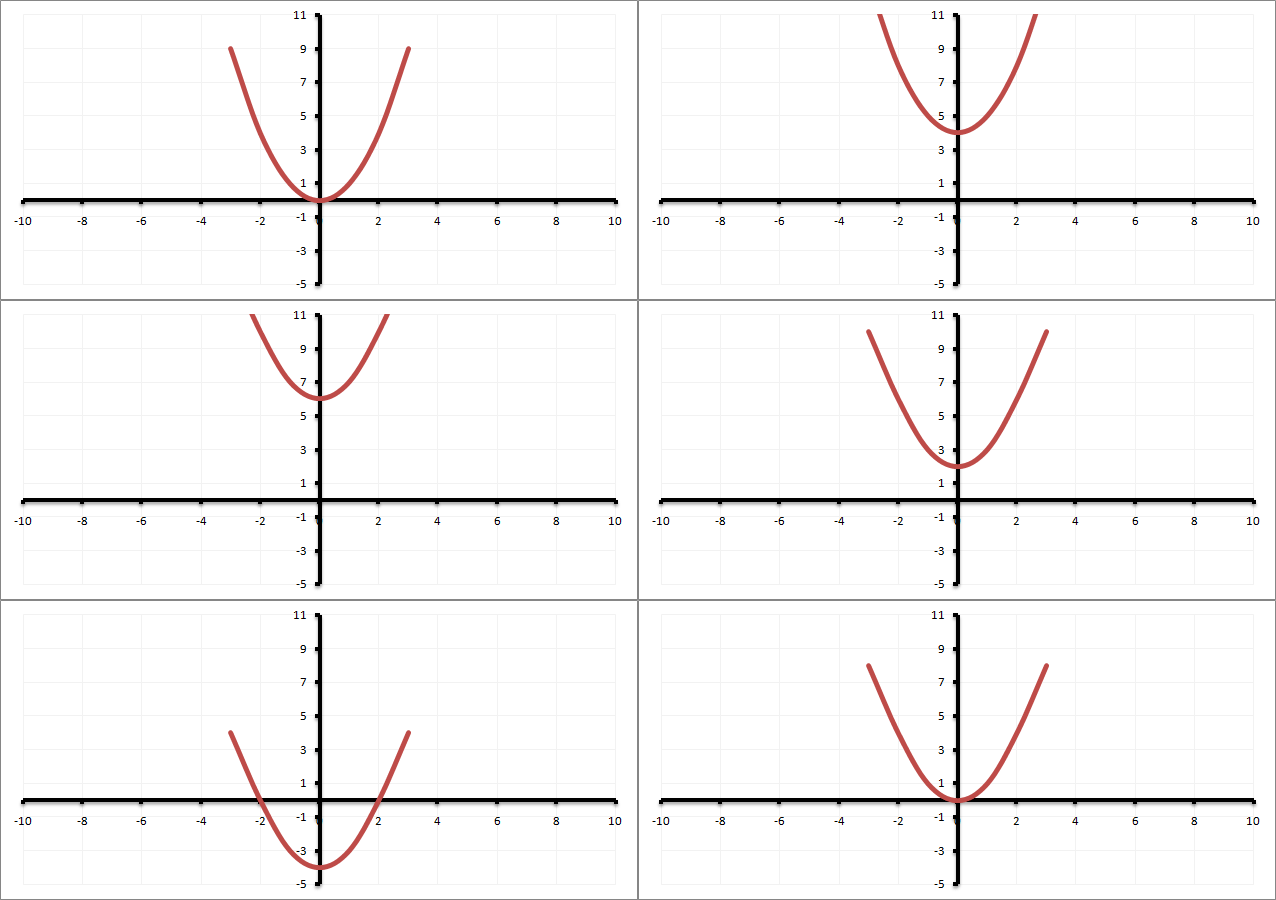
Adding or subtracting values at the end of an equation moves the curve down or upwards by that amount (in the y-axis) This has been shown in the following animation;
Here is another quadratic curve of y=x²;

What happens when we multiply the equation, the following illustration shows the result.
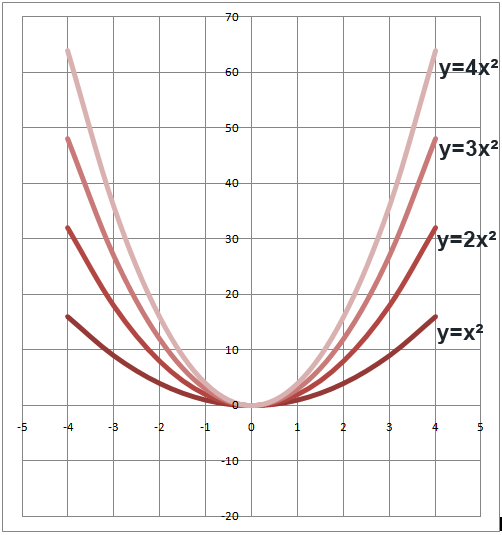
We can see that as we multiply the equation of y=x² with an increasing number the graph gets steeper or squashes inwards. We can conclude that;
Multiplying an equation stretches the curve upwards. The curve appears to be squashed inwards
Effect on the Cubic Graphs
We can see the same effect on the cubic graph of the conclusions we’ve made above. Here is the graph y=x3.
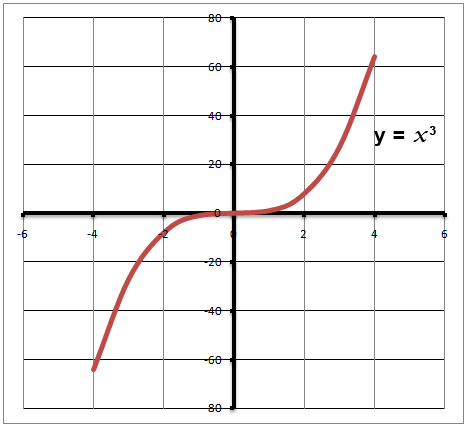
And now we have multiplied the graph equation with a different number.
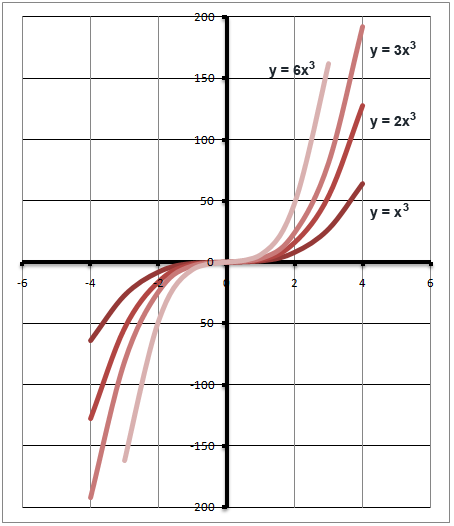
And now we’re subtracting or adding numbers from the equation as shown in the following Illustration.
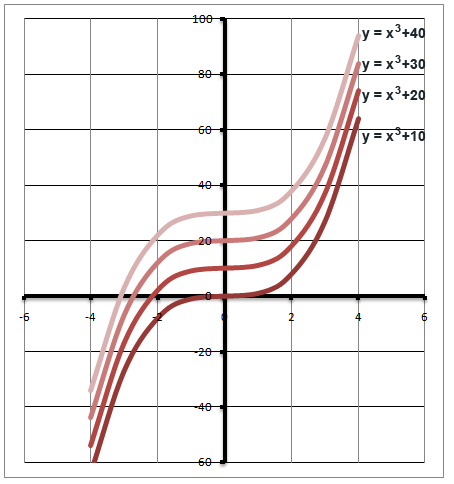
You can see that the same conclusions apply here as well. The above conclusions apply in all cases for the graphs.
Key points you have to remember are that the graphs get stretched in the y-axis if multiplied by a number, and transformed downwards when a number is subtracted from the equation or upwards when added. WHY: Well because always x is constant and the graph function/equation is written as y= so when you add or subtract, the result of the equation y= increases or decreases for each point or coordinate on the graph thus drifting up or downwards.
[slideshow]

cool this rll helped 🙂