Choosing the right distribution model
This article continues from the previous article so it may be a good idea to go through it. This article covers when to use the continuous uniform distribution model.
We shall explore these situation using examples.
Example
The length of a pen is measured to the nearest cm. Write down the distribution of the rounding errors R.
We can use the uniform distribution as a model for errors made by rounding up or down when recording measurements.
When collecting data; the error is the difference between the actual/true value, in this case length and the recorded length.
If we record a pen as being 10cm long then its length could be anywhere in the interval of 9.5cm. ≤ length ≤ 10.5cm. The error is therefore in the interval.
![]()
As it is reasonable to assume that the error is equally likely to take any of the values in the range;
![]()
Example
Suppose a bus arrives, on time, at a bus stop every 30 minutes. John arrives at the bus stop a random time without knowing when the next bus is due. Let X represents the time John has to wait for a bus to arrive at the bus stop.
John’s waiting time is uniformly distributed over the 30 minutes supposing the bus arrives on time and John arrives at a random time. Therefore this can be modelled with a continuous uniform distribution.
![]()
We can go further to calculate the probability that John will wait more than 6 minutes for a bus to arrive; that is;
![]()
Properties of a continuous uniform distribution

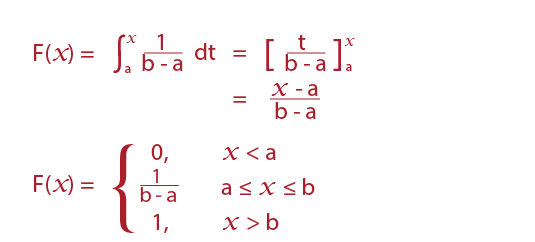
Finding E(X), Var(X), F(x);
If a ≤ x ≤ b;