Distance-Time Graphs
This chapter covers distance-time graphs. It explores how to draw and interpret distance-time graphs. Having prior knowledge of gradient of a straight line and speed will be very useful here.
What is kinematics
Kinematics is the study of an objects motion. Kinematics involves calculation of time, distance, displacement, speed and velocity. In kinematics we’re not so concerned with the objects mass or any forces that act on the object. In this chapter we shall be concentrating on motion in a straight line.
Straight line distance graphs
The graph below shows a distance-time graph for particles moving in a straight line.
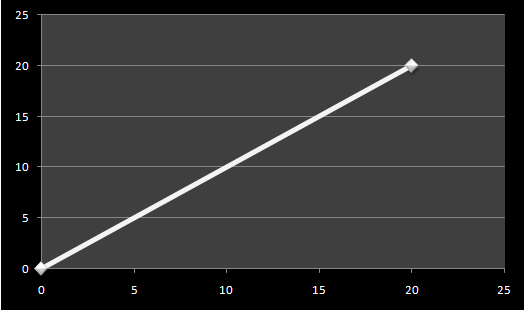
The graph shows how the distance of particles changes over time from a certain point. Time is always placed on the horizontal axis.
We can see on the graph that the distance of the particles increases at a steady rate, In other words the speed of the particles if constant.

On the distance –time graphs the speed is found by working out the gradient of the graphs as shown below;
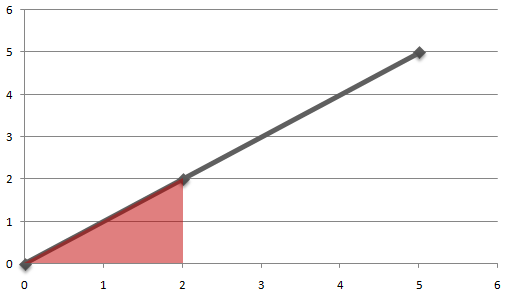


The speed unit is metres per second which we write as m/s or ms-1
Describing Distance-time graphs
Consider the description of the following distance-time graph;
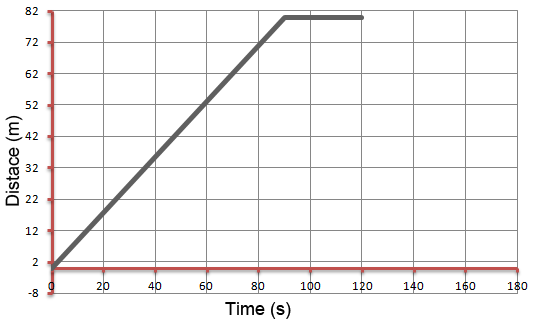
John sets off to school from home. He walks 80m in 90 seconds at constant speed. On the way he stops at the super market to buy some biscuits. After 30 seconds he walks home at twice her initial speed. We can draw a distance time graph to describe this activity. First we draw the vertical axis greater or equal to 80m such that we can place the values 0-80. Time is always placed on the horizontal axis. Therefore the distance will appear on the vertical axis in our situation as shown below.
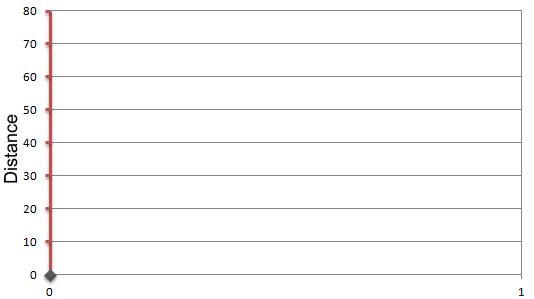
We know that John returns at twice his initial speed so it only takes half of the time it took from home. His total journey time is;
![]()
So now we know the minimum value that we must put on the horizontal axis. There are three stages to the journey that we can display on the graph. Here is John’s first walk from home shown below;
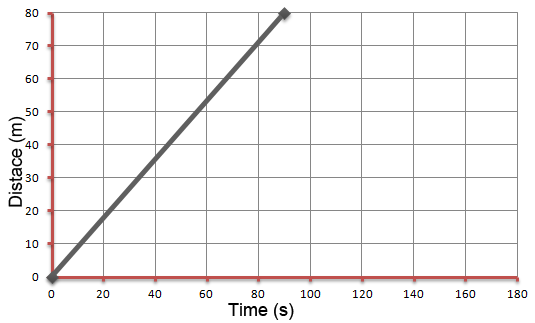
The second stage of the journey has what is known as zero gradient. You can learn more about gradients of a line here. This zero gradient indicates that the speed was zero.
The final stage of the journey is a slopping line going downwards. This line has a negative gradient. Although the line is going downwards the speed is positive. Remember the graph does not account for the speed but the distance and time. The last stage of the journey is shown below on the graph below. Return speed is distance over time. So we calculate the gradient of the area shown below;
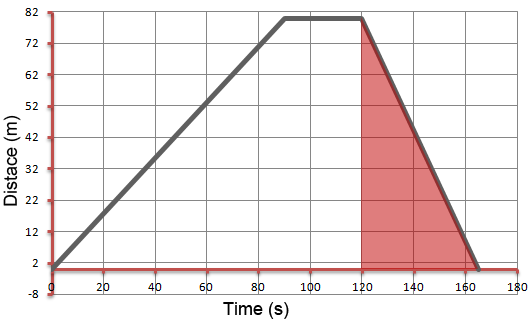
That is the return speed is;

Curved distance-time graphs
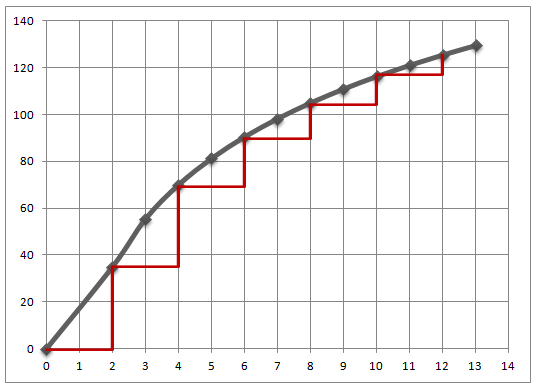
Distance-time graphs can also have curves. The graph below shows the distanced covered by a splinter during the first seconds of a 100m race.
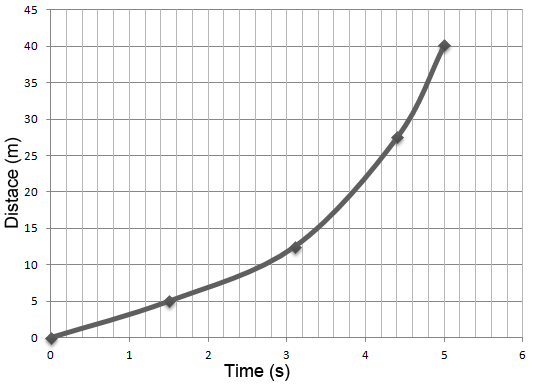
Just by examining the graph we can observe that the splinters speed increases exponentially over time. The height of the steps shown on the graph below increase from left to right. This shows that the distances travelled over the one second intervals are increasing, Meaning the splinter gaining speed over the time.
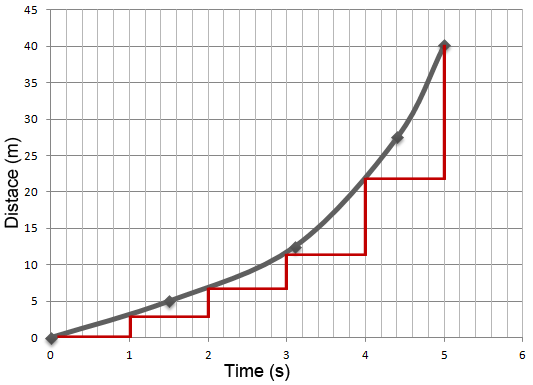
The graph above shows that the distance is increasing. The graph below shows the distance travelled over the two second intervals is decreasing. We can see that the heights of the ‘steps’ decreases from left to right. This graph is common for moving vehicles.
Racing
The graph below shows the progress of two racers John and Mark during a 10km race.
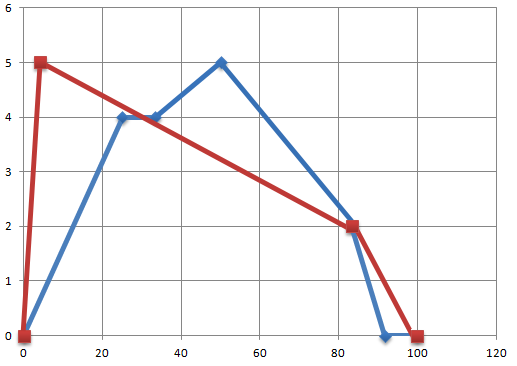
We can compare the strategies of the two racers over the first half of the race. We can see that John covers the first half of the race at a constant speed. Mark’s graph has the steeper line at the start, this must mean that Mark sets off quicker than John.
John tries to maintain a higher constant speed than Mark but stops to rest after 15 minutes. This is shown by the horizontal line. John over takes Mark, then Mark sets off after him but at a slower constant speed. The graphs intersect at the point where John over takes Mark. John reaches the halfway point about 5 minutes before Mark. How about you try describing the rest of the race using the graph?
Suppose we wanted to find John’s average speed for the race, we know that;


We want km per hour. So we multiply by 60 to get km per hour.

Similar examples and Further help
- MATH HELP: At example from Math help; read further about distance graphs by using ideas of vectors and pythagorean theorem to form a distance formula. Click here: Distance formula …we use what’s known as the distance formula to learn the distance between…
