Quadratic Inequalities
This chapter explores quadratic inequalities. The chapter insures that you gain knowledge that quadratic inequalities have two limits and solving quadratic inequalities by inspecting the graph. Before attempting this chapter you must have prior knowledge of linear inequalities and sketching quadratic graphs.
Quadratic inequalities introduction
If you’re good at solving equations it may be useful to think logically when solving inequalities. Below is an inequality.
![]()
Suppose we had to write down at least three integers that satisfied the inequality. To make the process simplified or get rid of the squared in the equation we would have to treat it like an equation. First we would square root both sides to get;
![]()
So now the integers that satisfy the inequality are;
![]()
That is not all. Notice that 3 is included in the satisfactory list, because of the ≤ sign. The biggest possible integer is a 3. You may assume that the solution is just x ≤3. You have to remember that quadratics always have limits so the negative integers will have to be included that is;\
![]()
So the complete inequality would be
![]()
![]()
Using quadratic graphs
We can also use graphs to show the solutions of the above inequality. The above inequality was.
![]()
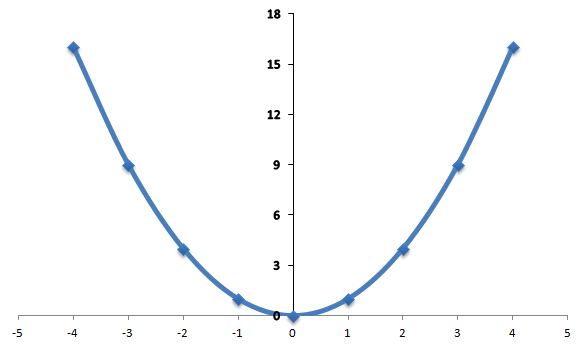
First we plot the graph of y=x² as shown below.
Next we plot where the height of the curve us equal to 9 as shown below. This must be x=-3 and x-3. The graph is less that 9 at x=-3 and x=3.
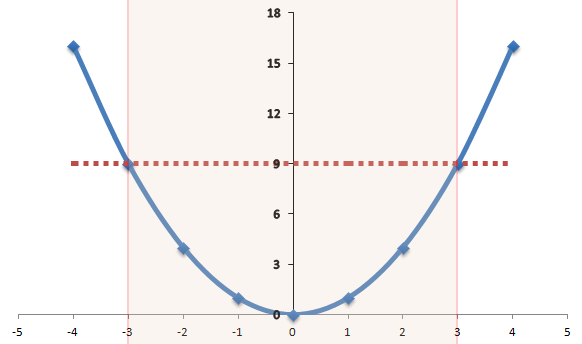
So we write the solution as;
![]()
We can continue further to use the same curve and lines. This time we look at where the curve is greater than 9. This is where x is less than -3 and x is greater than 3. So we write;
![]()
Simplifying the algebra before plotting on graph
It is necessary to simplify an equation when solving quadratic inequalities before plotting a graph, for example suppose we had to solve;
![]()
First we simplify the equation naturally to result;
![]()
…we can continue to simplify further;
![]()
Now we can plot a graph as shown below.
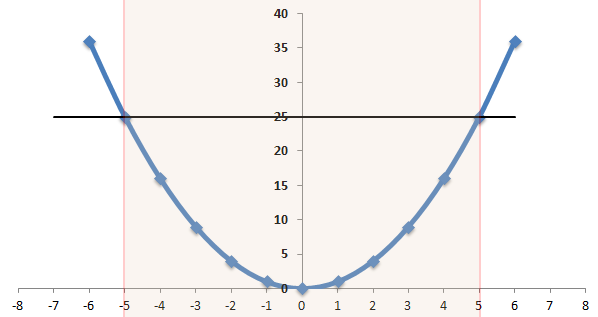
We write;
![]()
…or…
![]()
We can also solve inequalities by using trail and improvement. Below is an example to solve;
![]()
We need to draw a graph as we did above, first we factorise the quadratic to get the result;
![]()
Then we find the roots and y intercept…
![]()
![]()
The y intercept will be 5, that is;
![]()
Next we sketch the graph as shown below.
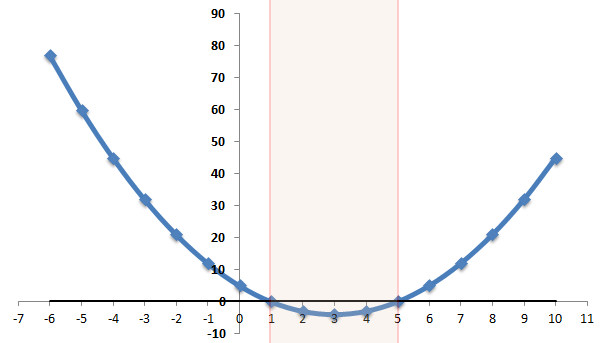
Now we need to find where the graph is less than zero. The solution to the equation is;
![]()

A few typos to fix:
“x > 5 and x -5 and x < 5"
"(x^2 – 1)(x – 5)" should be "(x – 1)(x – 5)"
In that last example where you have resolved it to the inequality:
(x-1)(x-5) <= 0
you might point out that this implies that one (and only one) of the factors must be negative. So either
x-1 = 0 hence x = 5
or
x-1 >= 0 and x-5 = 1 and x <= 5
One the second of these is possible, and the solution you show follows from that.
Thanks Karl,
I have corrected the typo errors. I will add that last suggestion soon.